
Standard deviation tells you how spread out data points are around the average, making it one of the most practical tools in descriptive statistics for judging consistency, volatility, and typical variation. In data analysis, descriptive statistics are the methods used to summarize a dataset so people can understand its center, spread, shape, and unusual values without reading every row individually. When teams ask whether sales are stable, test scores are tightly grouped, website traffic is unusually erratic, or manufacturing measurements are within tolerance, they are usually asking a standard deviation question even if they do not use the term. I rely on it constantly because raw averages can hide risk: two products can have the same mean return rate, yet one is predictable while the other swings wildly week to week. Standard deviation solves that problem by quantifying dispersion in the same units as the original data, which makes it easier to interpret than variance. As a hub topic within descriptive statistics, it also connects directly to the range, interquartile range, variance, z-scores, normal distribution, coefficient of variation, and outlier detection. Understanding standard deviation matters because many decisions depend not just on what is typical, but on how much typical conditions vary in real life.
To define it plainly, standard deviation measures the average distance of observations from the mean after accounting for all values in the dataset. A low standard deviation means the values cluster closely around the mean. A high standard deviation means the values are more dispersed. If a call center gets an average of 500 calls a day with a standard deviation of 15, staffing is far easier than if the average is still 500 but the standard deviation is 140. The first operation is stable; the second is volatile. In practice, standard deviation rarely stands alone. Good descriptive statistics work as a system. The mean and median describe central tendency, range and interquartile range describe spread, frequency distributions show concentration, and charts reveal shape. Standard deviation is strongest when those pieces are interpreted together. This article explains what standard deviation tells you, how to read it correctly, when it misleads, and how it fits into a broader descriptive statistics workflow used in business, research, education, quality control, and digital analytics.
What standard deviation tells you at a glance
Standard deviation tells you whether a dataset is tightly grouped or widely scattered around its mean. That answer supports several direct business and analytical judgments. First, it tells you consistency. In manufacturing, if the diameter of a machine part has a small standard deviation, the process is producing reliable output. Second, it tells you volatility. In finance, daily returns with a larger standard deviation are less predictable. Third, it tells you how representative the mean really is. I often explain this to stakeholders by saying that an average without spread is incomplete. An average delivery time of three days is reassuring only if most shipments actually arrive in roughly three days. If delivery times range from one day to ten days, the average is not a dependable expectation for customers.
Standard deviation also tells you how unusual a value may be relative to the rest of the data. If employee completion times average 42 minutes with a standard deviation of 4, a time of 43 minutes is normal, while 60 minutes is far from typical. This is why standard deviation is foundational for z-scores, process monitoring, forecasting assumptions, and benchmark comparisons. It does not identify causes by itself, but it highlights where to investigate. In web analytics, for example, sudden traffic changes are often first flagged because daily sessions move far beyond the usual standard deviation from the baseline mean. That makes standard deviation both a descriptive statistic and a practical alerting tool.
How standard deviation fits within descriptive statistics
Descriptive statistics aim to summarize data clearly before deeper modeling begins. In real analysis work, I treat this as a sequence. Start with count and completeness so you know how much data you have and where values are missing. Then measure central tendency using mean, median, and mode. Next, measure spread using range, variance, standard deviation, interquartile range, and sometimes median absolute deviation. After that, examine shape through skewness, kurtosis, histograms, or box plots. Finally, review outliers and segment results by relevant categories. Standard deviation belongs to the spread layer, but its meaning depends on the center and shape layers around it.
Consider customer order values. If the mean order value is $80 and the standard deviation is $12, spending is relatively concentrated. If the standard deviation is $95, the same mean may describe a business with a mix of tiny and very large orders. The median might reveal whether a few high purchases are inflating the mean. The interquartile range would show the middle fifty percent of order values, which is useful when extreme values distort standard deviation. In that sense, descriptive statistics work best as complementary measures, not competing ones. A strong hub understanding means knowing which statistic answers which question and when a single metric is insufficient.
How to interpret low and high standard deviation
A low standard deviation means most data points are close to the mean, indicating uniformity or stability. A high standard deviation means values are more spread out, indicating diversity, uncertainty, or process inconsistency. The important point is that low is not always good and high is not always bad. Context decides. In quality control, a low standard deviation is usually desirable because variation creates defects. In investment portfolios, higher standard deviation may indicate higher risk, but some investors accept that in pursuit of higher returns. In education, a low standard deviation in exam scores might suggest consistent instruction, but it might also indicate an assessment that failed to distinguish levels of mastery.
Interpretation becomes easier when you compare standard deviation to the mean and to operational thresholds. For example, a standard deviation of 5 units could be tiny in a dataset centered at 10,000, but very large in a dataset centered at 12. Analysts often use the coefficient of variation, which divides standard deviation by the mean, to compare relative variability across different scales. I use that often when comparing product lines with different revenue levels. Absolute spread alone can mislead. A line with a standard deviation of $20,000 in weekly sales may actually be more stable than one with a standard deviation of $5,000 if the first averages $500,000 and the second averages only $20,000.
| Measure | What it shows | Best use | Main limitation |
|---|---|---|---|
| Range | Difference between minimum and maximum | Quick sense of total spread | Heavily affected by outliers |
| Interquartile range | Spread of the middle 50% of values | Skewed data and outlier-resistant summaries | Ignores tails outside quartiles |
| Variance | Average squared distance from the mean | Statistical modeling and decomposition | Hard to interpret because units are squared |
| Standard deviation | Typical spread around the mean in original units | Comparing consistency and volatility | Sensitive to outliers and non-normal shape |
| Coefficient of variation | Relative spread compared with the mean | Comparing variability across scales | Unstable when the mean is near zero |
How standard deviation is calculated and why variance matters
The logic of the calculation explains the meaning. First, find the mean. Second, measure how far each value is from that mean. Third, square those deviations so negative and positive distances do not cancel out. Fourth, average the squared deviations to get the variance. Fifth, take the square root of the variance to return to the original units, producing the standard deviation. Population standard deviation uses the full population size in the denominator, while sample standard deviation uses n minus 1, a correction that reduces bias when estimating a population from sample data. In spreadsheets, this is the difference between functions such as STDEV.P and STDEV.S.
Variance matters because it is the mathematical engine underneath standard deviation. Many statistical procedures, from analysis of variance to regression diagnostics, are built on variance. Yet for communication, standard deviation is usually better because people can interpret it in familiar units: dollars, seconds, millimeters, percentage points, or test-score points. If average packing time is 6 minutes and the standard deviation is 1.2 minutes, managers can immediately picture that spread. If you reported only a variance of 1.44 square minutes, the result would be technically correct but far less intuitive.
What standard deviation does and does not tell you about normal distributions
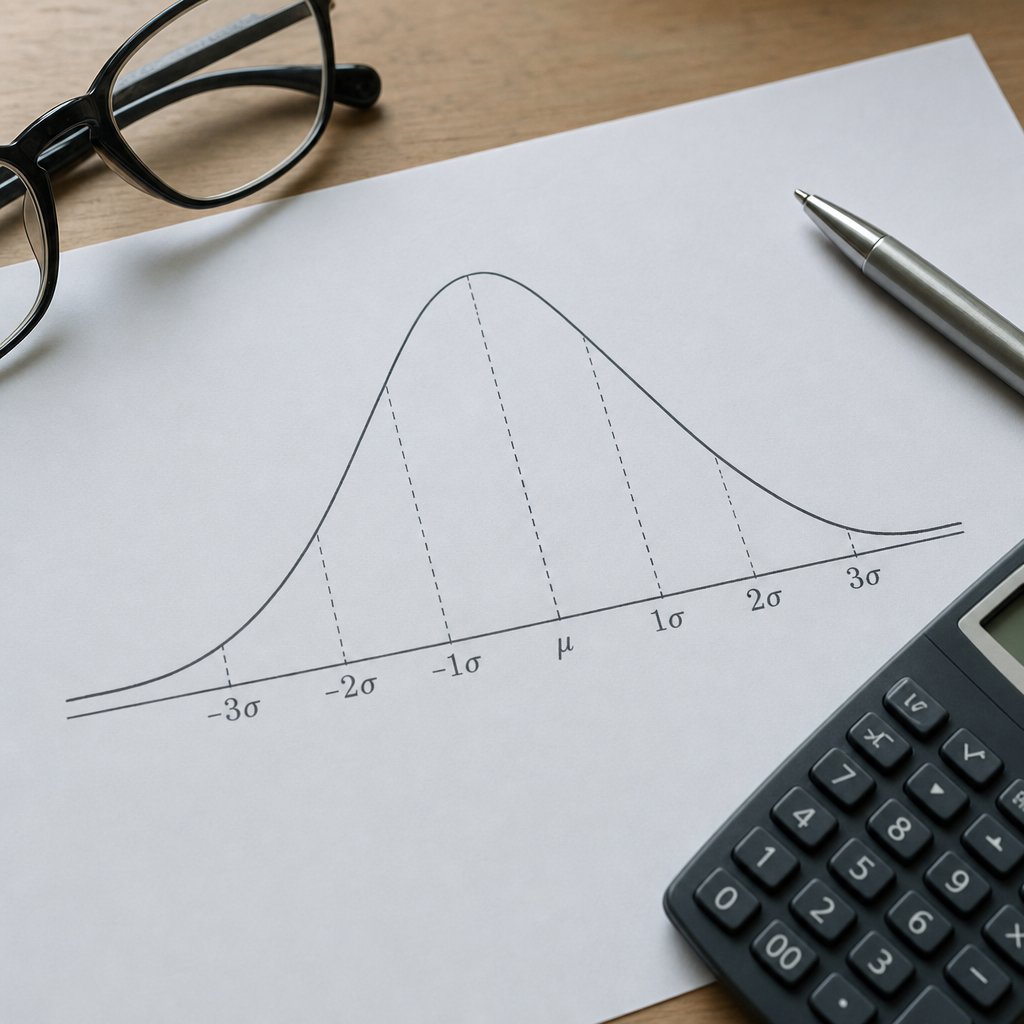
Standard deviation is often taught alongside the normal distribution because, in bell-shaped data, it supports a powerful rule of thumb. Roughly 68 percent of values fall within one standard deviation of the mean, about 95 percent fall within two, and about 99.7 percent fall within three. This helps analysts estimate what is typical and what is unusually far from the center. If customer wait times are normally distributed with a mean of 8 minutes and a standard deviation of 2 minutes, most waits should fall between 6 and 10 minutes, and very few should exceed 14 minutes. That is useful for service-level planning.
However, standard deviation does not guarantee normality, and many real datasets are skewed, heavy-tailed, seasonal, or multimodal. Household income, ad spend efficiency, emergency room arrivals, and viral social traffic rarely behave like textbook bell curves. In those cases, standard deviation still measures spread, but the familiar normal-distribution percentages may not apply. I have seen teams misuse it by assuming that any value more than two standard deviations from the mean is automatically abnormal. That can be misleading when data are naturally skewed or when a process has multiple operating states. Always inspect the distribution with a histogram, density plot, or box plot before drawing strong conclusions from standard deviation thresholds.
Common use cases across business, research, and operations
Standard deviation earns its place because it translates well across domains. In business reporting, it shows whether monthly revenue, conversion rate, or customer acquisition cost is stable enough for planning. In operations, it helps measure process capability and signal whether variation threatens service quality. In education, it shows how dispersed scores are around class averages. In healthcare, it summarizes spread in blood pressure readings, treatment times, or patient outcomes. In market research, it indicates whether opinions are tightly aligned or sharply divided. In finance, it is a core measure of asset return volatility, though professionals pair it with downside risk metrics because upward and downward deviations are treated symmetrically.
One practical example comes from A/B testing review. Suppose two landing pages both average a 4.8 percent conversion rate over several days. If one page shows a much larger day-to-day standard deviation, performance is less stable and may depend more on traffic mix or campaign source. Another example comes from warehouse operations. If average pick time per order is acceptable but the standard deviation is rising, throughput may deteriorate during peak hours even before the mean visibly worsens. Standard deviation helps teams move from average-based reporting to variation-aware management, which is closer to how real systems behave.
Limitations, outliers, and better companion metrics
Standard deviation is useful, but it has limits that good analysts should state clearly. It is sensitive to outliers because squaring deviations gives extreme values disproportionate weight. A single severe spike in transaction size, response time, or defect count can inflate standard deviation enough to make the whole process look unstable. It also assumes the mean is a sensible center, which is not always true in strongly skewed data. When I audit dashboards, I often find standard deviation reported without median, quartiles, or a distribution view, which invites overconfidence.
Better practice is to pair standard deviation with other descriptive statistics. Use the median when skew is present. Use the interquartile range when you need spread that resists outliers. Use box plots to spot extreme values visually. Use segmented analysis to avoid mixing unlike groups, because pooled data can create misleading variability. This is a version of Simpson’s paradox in practice: overall spread may conceal stable subgroups with different means. If average support resolution time combines simple tickets and technical escalations, the overall standard deviation can look high even though each ticket type is internally consistent. Descriptive statistics are strongest when they simplify reality without flattening important structure.
How to use standard deviation well in reports and decision-making
To use standard deviation well, report it in context, not isolation. State the mean, sample size, time period, and unit of measure. Show whether the value comes from a sample or full population. Check the distribution shape before applying normal-distribution interpretations. Explain practical meaning in business language, such as variability in weekly demand or consistency in cycle time. When comparing groups, consider coefficient of variation or confidence intervals if scales differ. In dashboards, trend standard deviation over time instead of treating it as a static number. Rising variability is often an early warning signal that averages miss.
As a hub topic in descriptive statistics, standard deviation opens the door to deeper analysis while remaining useful on its own. It tells you how far values typically stray from the average, whether a process is consistent, and whether the mean can be trusted as a summary. It works best when combined with the mean, median, interquartile range, visual distributions, and outlier checks. Used carelessly, it can exaggerate instability or hide skew. Used correctly, it improves forecasting, quality control, reporting, and interpretation. If you want stronger data analysis and interpretation, start by reviewing every important average alongside its spread, then build your descriptive statistics toolkit from there.
Frequently Asked Questions
1. What does standard deviation tell you in simple terms?
Standard deviation tells you how far data points typically fall from the average. In plain English, it helps answer the question, “Are these values usually close to the mean, or are they spread out all over the place?” A small standard deviation means the numbers tend to cluster tightly around the average, which suggests consistency and relatively low variation. A large standard deviation means the values are more widely dispersed, which points to greater variability, volatility, or unpredictability.
This is why standard deviation is one of the most practical tools in descriptive statistics. Instead of reading every value in a dataset one by one, you can use it to quickly understand how stable or scattered the data is. For example, if two sales teams have the same average monthly revenue, the team with the lower standard deviation is usually more consistent from month to month. If two students have the same average test score, the one with the lower standard deviation likely performed more evenly across exams.
On its own, the average tells you the center of the data. Standard deviation adds the missing context by describing the spread around that center. Together, they give a much more complete picture of what a dataset is actually doing.
2. Why is standard deviation important in data analysis?
Standard deviation is important because averages alone can be misleading. Two datasets can have the exact same mean but behave very differently. One might be tightly grouped and predictable, while the other might swing dramatically from low values to high ones. Standard deviation helps reveal that difference by measuring typical variation.
In practical data analysis, this matters a great deal. Businesses use standard deviation to judge whether sales, expenses, or demand are stable. Teachers and researchers use it to see whether scores are closely grouped or widely spread. Website analysts use it to understand whether traffic patterns are steady or unusually erratic. Financial analysts rely on it to estimate volatility and risk. In each of these examples, the goal is the same: understand not just where the data centers, but how reliably it behaves around that center.
Standard deviation also supports better decision-making. If a process has a low standard deviation, it is often easier to plan around because outcomes are more consistent. If standard deviation is high, teams may need to investigate what is causing the variation, whether that means seasonal effects, quality issues, market shifts, or outliers. In that sense, standard deviation is not just a descriptive statistic. It is often an early warning signal that something in the system deserves closer attention.
3. How do you interpret a high vs. low standard deviation?
A low standard deviation means the data points are generally close to the mean, so the dataset is relatively consistent. A high standard deviation means the values are farther away from the mean on average, so the dataset shows more spread and less consistency. The key idea is that standard deviation measures typical distance from the average, not whether the values are “good” or “bad.”
For example, imagine two stores that both average 1,000 visitors per day. If Store A has a low standard deviation, its daily traffic is probably fairly steady, perhaps hovering near that average most days. If Store B has a high standard deviation, it might have some very slow days and some very busy days, even though the average ends up being the same. That makes Store B harder to predict and manage.
Interpretation always depends on context. A standard deviation of 5 might be large in one setting and trivial in another. If average exam scores are 80, a standard deviation of 5 suggests scores are fairly concentrated. But if the average defect rate in manufacturing is 2 and the standard deviation is also 5, that would be enormous relative to the mean. So while “high” and “low” are useful starting labels, the most accurate interpretation comes from comparing the standard deviation to the scale of the data, the size of the mean, and the real-world expectations for that process.
4. Is standard deviation the same as variance?
No, standard deviation and variance are closely related, but they are not the same thing. Variance measures the average of the squared differences from the mean, while standard deviation is the square root of that variance. In simpler terms, variance comes first in the calculation, and standard deviation translates that result back into the original units of the data.
That difference in units is important. Because variance uses squared distances, it is mathematically useful but often less intuitive to interpret. For example, if your data is measured in dollars, the variance is expressed in squared dollars, which is not especially meaningful in everyday discussion. Standard deviation fixes that by returning the spread measure to dollars, points, visitors, or whatever the original unit happens to be. That makes it much easier to communicate and apply.
Most people use standard deviation when they want to explain variability clearly to a general audience. Analysts may still use variance in formulas, statistical models, and theoretical work, but standard deviation is usually the more practical and readable measure when interpreting descriptive statistics. So while the two are mathematically linked, standard deviation is generally the one people rely on to describe spread in a way that makes immediate sense.
5. Can standard deviation be used by itself to understand a dataset?
Standard deviation is extremely useful, but it should not be used by itself. It tells you about spread around the mean, but it does not fully describe the shape of the data, the presence of extreme outliers, or whether the mean is even the right center to focus on. To understand a dataset properly, standard deviation works best alongside other descriptive statistics such as the mean, median, range, quartiles, and visual tools like histograms or box plots.
For example, two datasets can have the same mean and standard deviation but still look very different. One might be roughly symmetrical and evenly distributed, while another could be heavily skewed or contain a few unusual values that distort the picture. In those cases, standard deviation alone may hide important details. This is especially true when the data includes outliers, because extreme values can pull the standard deviation upward and make the dataset appear more variable than most typical observations actually are.
The best way to think about standard deviation is as one important part of a larger descriptive summary. It is excellent for understanding consistency, volatility, and typical variation, but it becomes most powerful when combined with measures of center and tools that show distribution shape. Used that way, it helps turn raw numbers into a much clearer and more trustworthy interpretation of what the data is doing.





