
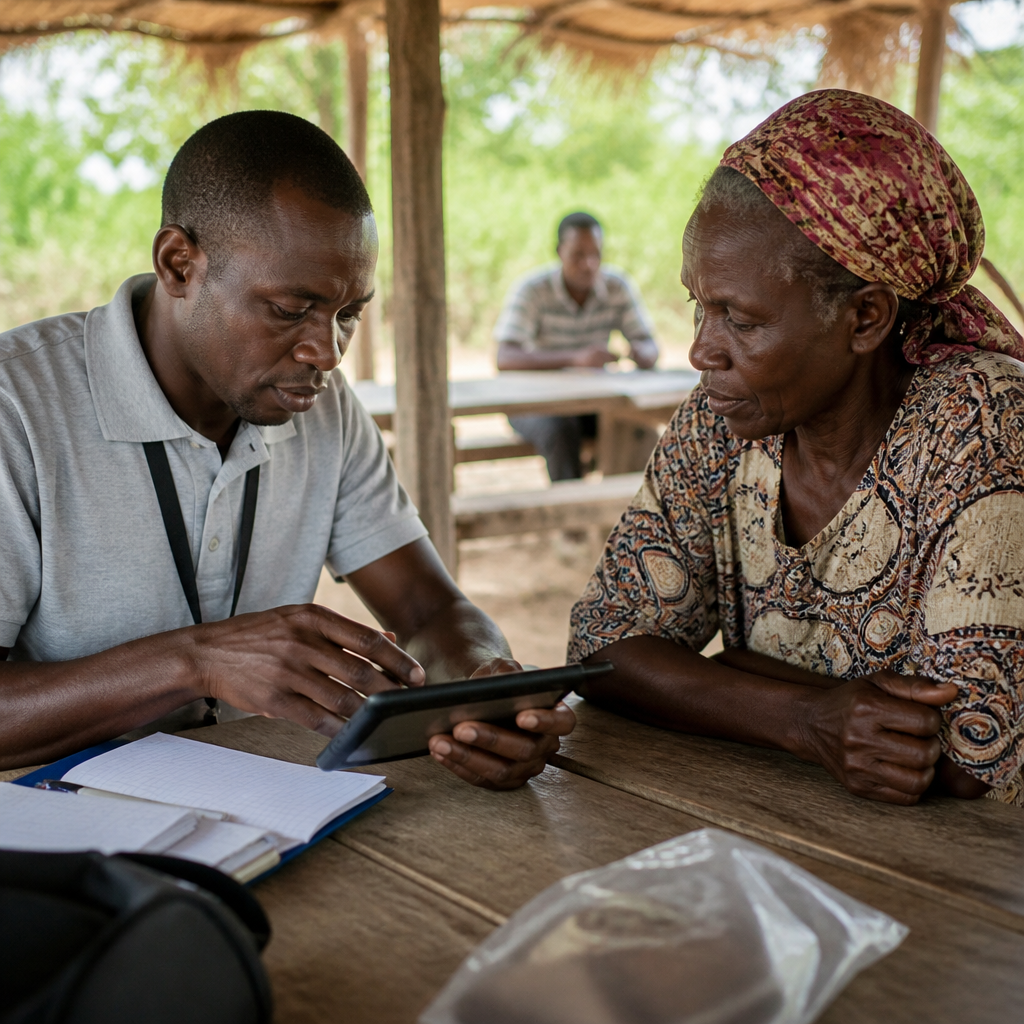
Data sources for impact evaluation determine whether a study produces credible evidence or attractive noise. In program evaluation, impact evaluation asks a specific question: what changed because of an intervention, not merely what happened after it. That distinction sounds simple, but in practice it depends heavily on the quality, timing, and structure of the data collected. I have seen promising evaluations fail because the team chose convenient data instead of decision-grade data, and I have seen modest datasets produce strong findings because the source matched the causal question.
At its core, impact evaluation estimates the effect of a program, policy, or service on outcomes such as income, health status, learning, employment, or behavior. The central challenge is constructing a credible counterfactual: what would have happened to participants without the intervention. Data sources matter because they shape measurement validity, baseline comparability, statistical power, attrition risk, and the feasibility of methods such as randomized controlled trials, difference-in-differences, regression discontinuity, matching, or interrupted time series. A cash transfer evaluation, for example, may rely on household surveys for consumption, government payment records for exposure, and satellite imagery for agricultural output. Each source answers a different part of the causal puzzle.
This matters for funders, governments, nonprofits, and implementation teams because the wrong source can bias results in predictable ways. Self-reported income may understate informal earnings. School attendance registers may improve when monitoring increases, even if learning does not. Health management information systems may miss private providers. Mobile phone data can reveal movement patterns but not motivation. A strong impact evaluation hub therefore begins with a practical map of data sources, their strengths, their limits, and the situations where each is most useful. This article provides that map and frames how to choose, combine, and validate data for credible impact findings.
What Counts as a Data Source in Impact Evaluation
A data source is any structured or unstructured origin of information used to measure treatment, outcomes, covariates, context, implementation, or spillover effects. In impact evaluation, the main categories are primary data collected specifically for the study and secondary data generated for another purpose. Primary sources include baseline and endline surveys, direct assessments, observations, biometric measures, qualitative interviews, and field experiments. Secondary sources include administrative records, transaction logs, learning management systems, electronic medical records, census files, labor market databases, tax records, remote sensing products, and digital trace data.
These categories are not interchangeable. Primary data gives control over questionnaire design, recall periods, sampling, and outcome definitions. That makes it valuable when evaluating outcomes not captured elsewhere, such as empowerment, aspirations, trust, or time use. Secondary data is often cheaper, faster, and more scalable. It can also reduce respondent burden and social desirability bias. When I evaluate workforce or education programs, I usually start by asking whether the key outcomes already exist in reliable records before designing a custom survey. If earnings can be observed in tax or payroll data, that source often outperforms self-report. If learning outcomes require curriculum-aligned testing, custom assessment becomes essential.
Good source selection follows the theory of change. Inputs and activities may be captured through monitoring systems, outputs through service records, intermediate outcomes through surveys or observations, and final outcomes through administrative or longitudinal data. The best impact evaluations often combine sources because no single dataset captures the full causal chain.
Primary Data: Surveys, Tests, Observation, and Biometrics
Primary data remains the backbone of many impact evaluations because it can be tailored to the exact estimand. Household and beneficiary surveys are common for measuring income, expenditures, food security, knowledge, attitudes, service satisfaction, or exposure to intervention components. Well-designed questionnaires use validated scales, consistent recall windows, and cognitive testing to reduce misinterpretation. In agriculture, evaluators may combine survey modules on yields with crop-cutting protocols because farmers frequently overestimate plot production. In financial inclusion studies, diary methods can capture volatile cash flows that annual surveys miss.
Direct assessments are especially important in education and skills programs. Attendance data does not equal learning, so impact evaluation typically requires standardized tests, competency assessments, or practical demonstrations. Early grade reading evaluations often use oral fluency and comprehension instruments, while technical training evaluations may use task-based assessments aligned to occupational standards. The same logic applies in health, where anthropometry, blood pressure, hemoglobin testing, or diagnostic screening can outperform self-reported health status.
Observation is another underused primary source. Structured classroom observation, facility audits, mystery client visits, and time-and-motion studies can measure implementation quality, provider behavior, and service readiness. In one service delivery evaluation I worked on, clinics reported medicine availability above ninety percent, yet spot checks found repeated stock-outs in rural facilities because inventory forms were updated only before supervision visits. Observation exposed the gap between reported compliance and actual conditions.
Biometric and sensor-based measures add precision when outcomes are physiological or behavioral. Wearables can measure activity and sleep. Water chlorination sensors can track use of treatment products. GPS devices can verify travel time to clinics or schools. These tools improve objectivity, but they introduce cost, consent, and data management complexity. They are most valuable when small measurement error would materially change the estimated treatment effect.
Secondary Data: Administrative Records and Routine Systems
Administrative data is often the most policy-relevant source because it reflects real operations at scale. Education evaluations use enrollment, attendance, progression, and examination records. Health evaluations rely on routine service data, claims records, immunization registers, and hospital discharge systems. Social protection studies use beneficiary registries, payment files, case management systems, and grievance logs. Labor market programs may link participants to unemployment insurance, payroll, or tax records to estimate effects on formal employment and earnings.
The major advantages are coverage, frequency, and lower marginal cost. Administrative datasets can support large samples, subgroup analysis, and long follow-up periods that would be prohibitively expensive with repeated surveys. They are also less prone to recall bias. When state unemployment insurance wage records are available, they usually provide more reliable quarterly earnings trajectories than participant self-reports. Similarly, student longitudinal data systems allow evaluators to study persistence, graduation, and postsecondary transitions years after a school intervention ends.
But routine systems are not automatically high quality. They are created for management, compliance, or payment, not causal inference. Common issues include missing identifiers, inconsistent coding, duplicate records, delayed entry, underreporting from private or informal providers, and incentives that distort data. A vaccination campaign can raise reported coverage because facilities improve reporting discipline, not because immunization increased. Administrative data is strongest when governance is stable, identifier systems are robust, and the evaluator understands the business rules behind each field.
Digital Trace, Geospatial, and Big Data Sources
Newer impact evaluations increasingly use digital trace and geospatial data to complement conventional sources. Mobile phone call detail records can estimate mobility patterns, network changes, or response to shocks. Electronic transaction data can show spending behavior, merchant activity, or savings frequency. Learning platforms produce clickstream data on engagement, persistence, and mastery pathways. Satellite imagery and remote sensing products can estimate crop health, night-time lights, flood exposure, land use change, and even building density.
These sources are powerful when outcomes are spatial, behavioral, or high frequency. A livelihoods program targeting smallholders, for example, might combine household surveys with Normalized Difference Vegetation Index data to assess crop performance under variable rainfall. A transport intervention may use GPS traces to estimate travel time reductions more accurately than respondent recall. During crises, near-real-time mobility or transaction data can reveal whether assistance changes market access or household resilience faster than periodic surveys.
However, digital data brings serious caveats. Coverage can be selective because poorer, older, or rural populations may be underrepresented in platform or device-based systems. Algorithms used to derive indicators may be proprietary. Location precision, temporal aggregation, and changes in platform behavior can affect comparability over time. Evaluators should treat these sources as measurement tools that require validation, not as inherently superior evidence.
| Data source | Best use in impact evaluation | Main strength | Main limitation |
|---|---|---|---|
| Household or beneficiary survey | Outcomes not captured elsewhere, perceptions, consumption, time use | Customizable and theory-driven | Recall and social desirability bias |
| Administrative records | Enrollment, payments, service utilization, earnings, long-term tracking | Large scale and low marginal cost | Quality varies with system incentives |
| Direct assessment or biometrics | Learning, skills, health, physical measures | High measurement precision | Costly and operationally complex |
| Geospatial or digital trace data | Mobility, exposure, agriculture, infrastructure, high-frequency behavior | Timely and spatially rich | Coverage bias and validation needs |
Matching Data Sources to Evaluation Design
The right source depends on the identification strategy. Randomized controlled trials need data that confirms treatment assignment, uptake, and outcomes while preserving comparability between treatment and control groups. Baseline surveys are useful for balance checks and precision gains, but not always mandatory if high-quality pre-intervention administrative data exists. Quasi-experimental methods usually place heavier demands on longitudinal records. Difference-in-differences requires comparable measurements before and after the intervention for treatment and comparison groups. Regression discontinuity requires accurate scores around the cutoff and enough observations near the threshold. Matching approaches require rich covariates measured before treatment selection occurs.
Interrupted time series depends on many repeated observations collected consistently over time, making routine administrative or sensor data especially valuable. Spillover analysis may require geocoded data to identify exposure beyond treated units. Mediation analysis often benefits from mixed sources, such as implementation logs for dosage and surveys for behavioral change. In every case, source selection should be driven by the estimand, not by what is easiest to download.
One practical rule I use is this: if the evaluation design relies on trends, choose sources with stable definitions over time; if it relies on thresholds, audit the assignment variable; if it relies on self-reported change, validate with an objective proxy whenever possible. This discipline prevents elegant methods from resting on weak measurement.
Data Quality, Ethics, and Integration
High-quality impact evaluation data is accurate, complete, timely, consistent, and fit for purpose. Evaluators should assess reliability at the variable level, not just at the dataset level. Key checks include item nonresponse, heaping, impossible values, outlier patterns, enumerator effects, mode effects, panel attrition, and linkage error. For administrative systems, review data dictionaries, form revisions, reporting incentives, and identifier logic. For surveys, pilot extensively, back-check interviews, and monitor paradata such as interview length and breakoffs.
Ethics and governance are equally important. Consent must match actual data use, especially when linking datasets or collecting passive digital traces. Personally identifiable information should be minimized, encrypted, and access-controlled. Some administrative linkages require formal data-sharing agreements, legal review, and secure research environments. Health studies often align with standards such as HIPAA in the United States, while European work may require GDPR compliance. Ethical review is not a bureaucratic afterthought; it is part of data quality because participants who do not trust the process give worse data or refuse participation altogether.
Integration across sources often produces the strongest evidence. Linking survey data to program records can improve exposure measurement. Merging geospatial layers with household panels can control for drought, conflict, or travel time. Triangulation matters when findings diverge. If beneficiary surveys show increased clinic use but facility data does not, the discrepancy may reveal shifts to private providers, duplicate household reporting, or registration failures. Good evaluators investigate these contradictions rather than averaging them away.
Building a Data Strategy for an Impact Evaluation Hub
A strong data strategy starts early, before instruments are drafted or records requested. Define the primary outcome, specify the counterfactual, map the theory of change, and identify which source best measures each link in that chain. Then test feasibility: access permissions, sample frame quality, expected missingness, timing, cost, respondent burden, and linkage potential. For a sub-pillar hub on impact evaluation, this matters because every deeper article—on survey design, administrative data linkage, randomized trials, quasi-experimental methods, or mixed methods—should connect back to source choice as a foundational decision.
The most credible evaluations rarely depend on a single dataset. They use the minimum combination of sources needed to measure treatment, outcomes, and context with defensible accuracy. For practitioners, the priority is simple: choose data that can survive scrutiny from technical reviewers, implementers, and decision-makers alike. Start with the causal question, audit each source against that question, and build validation into the design. If you are planning an impact evaluation, review your data sources before selecting your method, because better source decisions produce better evidence and better program decisions.
Frequently Asked Questions
What makes a data source suitable for impact evaluation?
A suitable data source for impact evaluation does more than describe activity or outcomes in a general sense. It must help answer the causal question at the center of the study: what changed because of the intervention, compared with what would have happened otherwise. That means the data source needs to align closely with the theory of change, measure outcomes that matter, and do so at the right level of analysis, whether that is the individual, household, school, clinic, firm, or community. Good data for impact evaluation are not simply available; they are fit for purpose.
Several qualities matter. First, validity: the data should measure the concept you actually care about, not a rough proxy chosen for convenience. Second, reliability: the measure should be collected consistently across time, locations, and groups. Third, timing: the data must capture conditions before the intervention when possible, during implementation if needed, and after enough time has passed for effects to reasonably appear. Fourth, comparability: if you are estimating differences between treatment and comparison groups, the data must be gathered in a way that supports fair comparison. Fifth, completeness: missing data, uneven coverage, and selective reporting can distort findings and weaken credibility.
In practice, the best data source is often the one that combines methodological relevance with operational realism. Administrative records may be inexpensive and continuous but may not capture key outcomes. Surveys can measure rich outcomes and mechanisms but may be costly and vulnerable to recall bias. Monitoring data can track implementation intensity but usually should not be treated as a stand-alone source of impact evidence. A strong evaluator does not ask, “What data do we already have?” and stop there. The better question is, “What data would let us make a credible decision about whether the intervention caused meaningful change?”
Why is baseline data so important in impact evaluation?
Baseline data matter because they establish the pre-intervention starting point. Without that starting point, it becomes much harder to distinguish change caused by a program from differences that already existed before the program began. In impact evaluation, that distinction is essential. If one group performs better at the end of a study, the key question is whether the intervention created that gap or whether the gap was already there from the beginning. Baseline data help answer that question with much greater confidence.
Baseline information also improves statistical precision and strengthens design quality. In randomized evaluations, baseline measures allow analysts to check balance across treatment and control groups and to adjust for pre-existing variation in outcomes. In quasi-experimental designs, baseline data can be even more critical because they support matching, trend analysis, and credibility checks about comparability. They also help identify differential attrition, sample composition changes, and implementation issues that might otherwise be missed until the endline, when fixing them is no longer possible.
Beyond methodology, baseline data are valuable for interpretation. They tell you whether the target population was already improving, already declining, or highly heterogeneous before the intervention started. That context helps decision-makers avoid overstating findings. A modest effect may be meaningful in a difficult context, while a large post-program outcome may be less impressive if participants were already outperforming others before receiving support. When baseline data are missing, evaluators often have to rely on retrospective recall, historical records, or cross-sectional comparisons, all of which are generally less robust. If there is one lesson experienced evaluation teams learn early, it is this: collecting credible baseline data is usually far easier and cheaper than trying to reconstruct the past later.
Can administrative data be used for impact evaluation, or are surveys always better?
Administrative data can absolutely be used for impact evaluation, and in some cases they are the best option. They are especially useful when they cover large populations, are collected routinely, and track outcomes over time in a standardized way. Examples include school attendance records, health service utilization data, tax records, social protection registries, employment records, or justice system data. These sources can reduce cost, minimize respondent burden, and make it possible to study outcomes at scale or over long periods. They are particularly powerful when linked across systems or combined with strong evaluation designs such as randomization, regression discontinuity, or difference-in-differences.
That said, administrative data are not automatically high quality simply because they are official. They may contain coding errors, incomplete fields, inconsistent definitions across sites, delays in reporting, and incentives that shape how information is entered. Sometimes the data capture program operations better than real outcomes. A clinic system might record visits, for example, but not patient well-being. A school database may show enrollment but not meaningful learning. Administrative systems are also often designed for compliance, reimbursement, or management, not for causal inference. That means evaluators must assess data provenance, measurement rules, missingness patterns, and whether records are equally complete for treatment and comparison groups.
Surveys are not always better, but they are often better for measuring outcomes that administrative systems miss. Surveys can capture knowledge, attitudes, income sources, time use, empowerment, satisfaction, informal employment, consumption, and many other dimensions that rarely appear in routine records. They can also be tailored to the evaluation question and timed to the intervention. The tradeoff is that surveys require careful instrument design, trained enumerators, quality control, and attention to nonresponse and social desirability bias. In many strong evaluations, the best approach is not administrative data versus surveys, but administrative data plus surveys, each used for what it does best.
How do evaluators decide between primary and secondary data sources?
Evaluators choose between primary and secondary data sources by starting with the decision the evaluation needs to support, not with the data that happen to be easiest to obtain. Primary data are collected specifically for the evaluation, such as household surveys, interviews, direct assessments, observations, biomarker collection, or facility audits. Secondary data already exist, such as administrative datasets, census files, national surveys, digital platform records, or historical program records. The right choice depends on whether existing data can credibly measure the outcomes, timing, population, and comparison needed for causal analysis.
Secondary data are attractive because they can save time and money, especially when budgets are limited or the intervention covers large populations. They may also allow access to pre-intervention trends or long-term follow-up that would be difficult to build from scratch. But using secondary data well requires discipline. Evaluators need to understand who collected the data, why they were collected, how variables were defined, how often collection occurred, what populations were excluded, and whether there were changes in measurement over time. A dataset can look impressive in size and still be weak for evaluation if key variables are poorly defined or important subgroups are missing.
Primary data become necessary when the needed outcomes are not available elsewhere, when data quality in existing systems is too weak, or when the evaluation requires measures tailored to specific mechanisms or beneficiary experiences. They are also essential when there is concern that routine data are affected by the intervention itself in ways that bias measurement. For example, if a program improves reporting rates rather than actual outcomes, administrative improvements could be mistaken for impact. The most practical answer is often a mixed-source strategy: use secondary data where they are strong, collect primary data where gaps are material, and design the combined system so that each source validates or enriches the others. That is usually how evaluations move from convenient evidence to decision-grade evidence.
What are the most common data problems that undermine credibility in impact evaluation?
The most common credibility problems are not usually dramatic; they are ordinary weaknesses that quietly accumulate until the findings become hard to trust. One major issue is poor outcome measurement. If the indicators do not reflect the intended change, the evaluation may answer the wrong question with great precision. Another frequent problem is bad timing. Data collected too early may miss real effects, while data collected too late may mix intervention effects with unrelated changes in the environment. Missing baseline data, irregular follow-up intervals, and weak tracking of treatment exposure can all make it difficult to interpret results clearly.
Selection and comparability problems are equally damaging. If treatment and comparison groups differ in important ways that are not properly addressed by the design, the evaluation may confuse pre-existing differences with program impact. Attrition is another common threat, especially if dropout is related to outcomes or differs between groups. Data quality failures at the field level also matter: inconsistent enumerator practices, weak supervision, survey fatigue, recall bias, social desirability bias, and translation issues can all reduce reliability. In administrative data, common threats include duplicate records, shifting definitions, incomplete reporting, and changes in system coverage over time.
Perhaps the most underestimated problem is choosing data because they are available rather than because they are adequate. Teams under pressure often settle for indicators that are easy to collect, even when those indicators cannot support the causal claims stakeholders want to make. That is how studies produce attractive noise: outputs are mistaken for outcomes, correlation is presented as impact, and polished dashboards substitute for evidence. The solution is not perfectionism but discipline. Define the causal question clearly, map the required evidence, assess each data source honestly, pilot instruments, document limitations, and build quality assurance into the process from the start. Credible impact evaluation depends less on having more data than on having the right data, collected well, at the right time, for the right comparison.